(Or at Least Looking Nervously Over Its Shoulder)
Yesterday at Databricks AI Days in Calgary, someone stood up and confidently declared that traditional BI is dead.
Now, this is the kind of statement you expect at an event like this. It’s bold, a little dramatic, and usually followed by a slide deck that suggests everything you’ve ever built is obsolete and you should start fresh immediately.
But this time… it didn’t feel entirely like marketing.
It felt a little bit like foreshadowing.
I’ve spent years watching a strange belief persist in the wild. The idea that something like Power BI is a substitute for actual data management. That a collection of dashboards duct-taped together is roughly equivalent to a well-designed medallion architecture.
Despite overwhelming evidence to the contrary, some people still treat “making charts” as the endgame, rather than the last mile of a much bigger system.
So naturally, when given access to Databricks’ new agentic tool, Genie Code, I did what any responsible professional would do.
I ignored pipelines, ignored wells, ignored anything remotely practical…
…and loaded NHL data.
Because if you’re going to test the future of data platforms, you might as well make it about something that actually matters.
The Dumbest Prompt I Could Think Of
I had a pretty solid dataset already. Every NHL player. Every game. Full season stats. Clean, structured, and sitting nicely in a table.
So I opened Genie Code and gave it the most unhelpful instruction imaginable:
“Build me a dashboard.”
No context.
No definitions.
No semantic layer.
No explanation of what the data even was.
Just chaos.
The kind of request that would normally make a data analyst quietly close their laptop and go for a walk.
And it… worked.
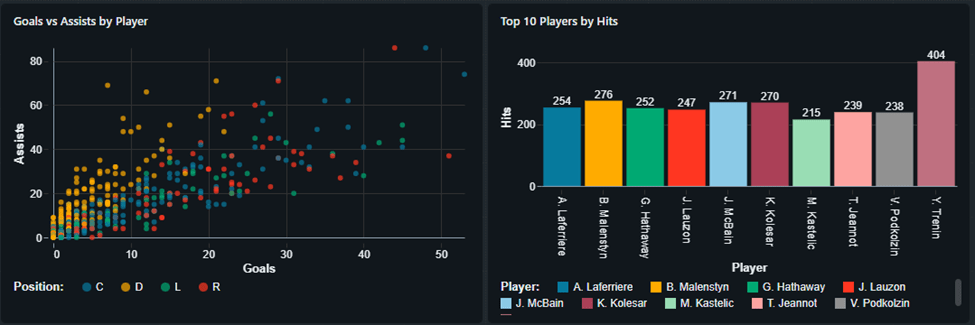
It generated visuals. It built a leaderboard. It sorted players by points. It did all the things you would expect, without asking me to clarify anything.
At this point, I started to feel a little uneasy. The sponsor, BDO, had recently shown a picture of the Terminator…
Escalating the Nonsense
Naturally, I pushed it further.
I asked it to:
- Add defensemen
- Calculate points per game
- Handle mid-season trades correctly
- Filter to playoff teams only
It paused briefly to ask what constituted a “playoff team” since I hadn’t provided team-level data. Fair enough. That’s on me.
But once I clarified, it executed everything cleanly.
No rewiring pipelines.
No rewriting queries.
No reworking dashboards.
Just… done.
Predicting the Future (Casually)
Now, I had an ulterior motive. The NHL playoffs were approaching, and I needed an edge for my annual playoff pool.
So I escalated again.
I asked it to project playoff performance.
Not just based on standings or team strength, but based purely on individual player performance. Then I asked it to estimate how many games each team would play.
The first attempt was… creative.
Colorado winning the Cup in 14 games (over Edmonton). Physics, rules, and common sense politely ignored.

So I nudged it:
- Explained best-of-seven series
- Clarified elimination structure
- Mentioned that two Western teams cannot meet in the final (important detail, apparently)
After a couple iterations, it locked in.
And what it produced was surprisingly coherent:
- Realistic series lengths
- Logical elimination paths
- A full playoff projection
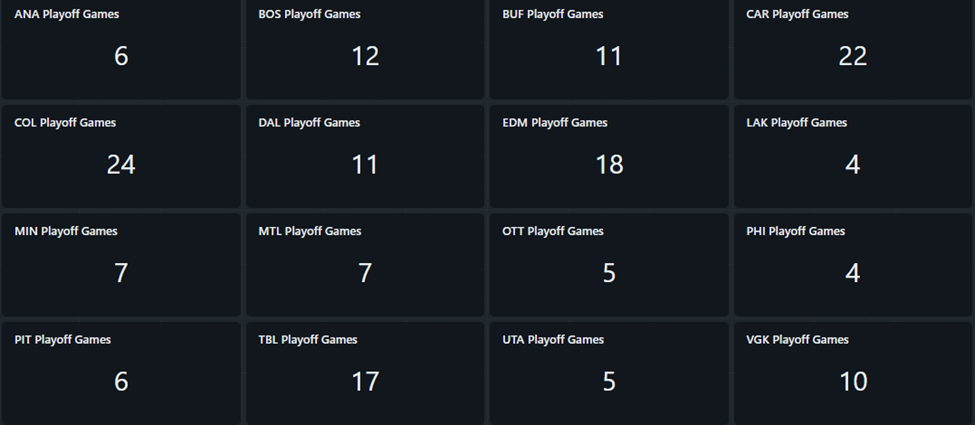
Colorado over Carolina in the final, for those keeping score.
Sorry, Kings fans. It’s not looking great.
The Part That Actually Matters
Here’s the thing that stuck with me.
This entire process took about 30 minutes.
No data movement.
No pipeline rebuilds.
No dashboard tweaking.
No wrestling with filters or visuals.
The AI had direct access to the data. Same environment. Same context. No friction.
That changes everything.
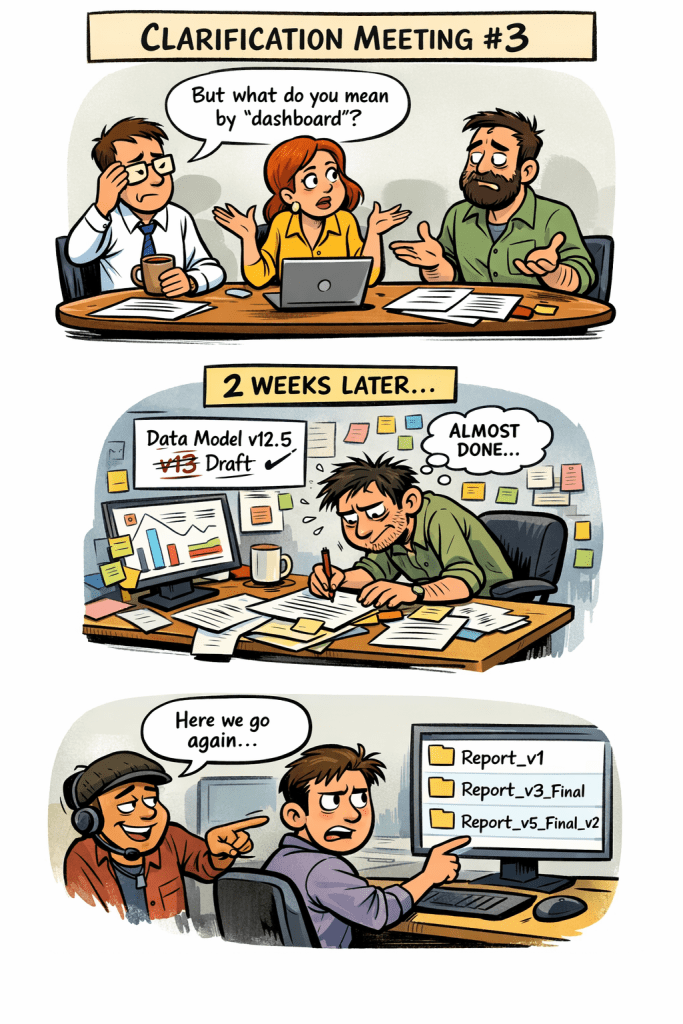
Traditional BI tools were built for a world where:
- Data was slow
- Access was limited
- Insight required translation
This is a different world.
Now:
- You grant access
- You describe intent
- The system builds, iterates, and refines with you
It’s not just faster. It’s fundamentally different.
So… Is BI Dead?
Not quite.
But it’s definitely sweating.
There will always be a long tail of people holding onto familiar tools, comfortable workflows, and dashboards that took three months to build and therefore must be valuable.
But after yesterday, it’s hard to ignore what’s coming.
We’re moving from:
“Build me a dashboard so I can analyze the data”
to:
“Here’s the data. Tell me what matters.”
And once you experience that shift, it’s very hard to go back.
